
Revisiting QBasic
FOR a! = 0.001 TO 4 STEP 0.001

A recent post on Chess Chat mentioned QBasic, which brought back some memories. I was introduced to the language in about 1995 or 1996, aged 11 or 12, and I spent a lot of time with it until mid-2000, after which I matured into such more sophisticated endeavours as playing Minesweeper for three hours a day.
For another few years I’d occasionally return to the language if I wanted to do something that wasn’t inherently Windows-based (for which I went to Visual Basic). A search of my archives for *.BAS files suggests that I last opened the QBasic IDE, until preparing this post, in 2003. By then I was at uni, and that small hobby project – playing musical notes and simultaneously drawing them on a staff – is uninteresting to me.
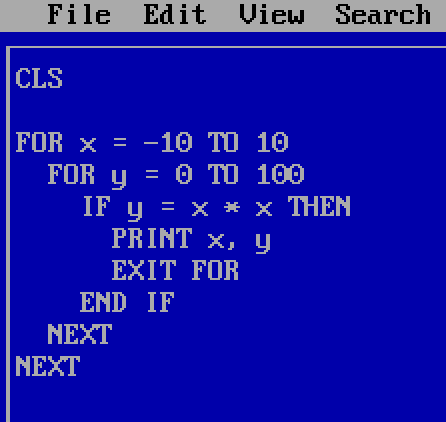
I want to know how I programmed before I had any mathematical sophistication. When I didn’t even know how to solve a quadratic equation, what sort of problems did I take on, and how did I solve them? One memorable time – literally memorable, a rare programming moment from that era that I still remember – I drew a simple y = x^2 parabola, let’s say from x = −10 to x = 10. The FOR loop over x was fine, but for each x value, I calculated y by looping from 0 to 100 and testing if y was equal to x * x. Imagine something like this, with graphics instead of just printing the numbers:1
Long before I had any understanding of efficient algorithms, I recognised that I could save myself a for loop by setting the y value directly. My first attempt though, with its astonishing inefficiency, is the sort of thing I’d like to revisit: early successes in finding some way to make a program work, before I realised that there might be better ways. But almost all my old code is lost.
(I once read some of my writing from high school; it was embarrassing and I have no desire to ever do so again. But my naive manipulation of symbols doesn’t make me cringe like my naive prose.)
To get me started, I was given a little script by a family friend. It PRINTed some funny ASCII characters using CHR$ calls and then immediately cleared the screen with a CLS. Then some more text was displayed, a little for-loop illustration with asterisks.
On the hand-me-down 386 that I got to keep in my bedroom, those funny ASCII characters stayed visible just long enough for me to glimpse them before the CLS. Because they disappeared so quickly, I didn’t focus on that part of the code; for some time I assumed that they served some purpose, that they were a necessary invocation prior to an initial clearing of the screen.
Instead I learned some manipulation of the lines that printed to the screen and stayed printed. But my recollection is that that script didn’t give me a sense of why I should want to write computer code. Such motivation came instead, I assume, from searching ‘qbasic’ on Yahoo with our new Internet connection. (For this I needed to use the family Pentium, which I commandeered for many hours.)
There was a thriving QBasic community in those days, and I downloaded lots of arcade games and graphics demos. I don’t have a sense of how much time I spent running other people’s code versus writing my own. Probably the balance was in favour of the former, though I must have done a decent amount of both.
The first and biggest ‘Aha’ moment I had – a realisation that I could program a computer to do something interesting – came a little after learning how to draw graphics. After switching to one of the SCREEN modes, the PSET command sets a pixel to a given colour. Starting with a blank screen, I tried setting the pixel at (0, 0), then at each step increasing the x-coordinate by 1 and the y-coordinate by 1 more than the previous increase. Something like this, but probably twice as long and disorganised somehow:
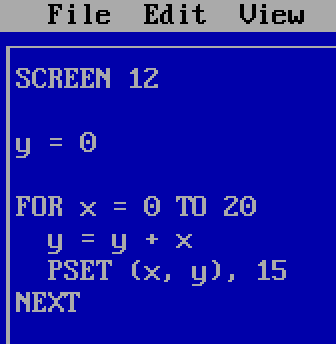
(I probably used colour 1 rather than colour 15, but it is hard to see a darker colour in a 640×480 screenshot on a modern screen; pixels were bigger in those days.)
The output was a series of dots that could be joined into a curve:
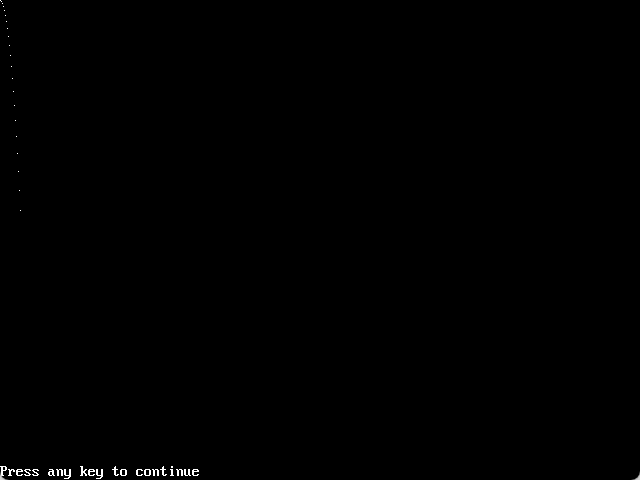
I assume I didn’t work out that the y-coordinates were the triangular numbers. I just recognised that it was within my power to make a non-trivial picture with simple mathematical manipulations on a computer.
Presumably I would have caught the programming bug from writing some other piece of code, if I hadn’t thought to try increasing the increments in y. But those dots are what did it, and they hold a good deal of sentimental value for me.
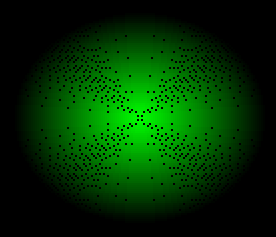
The oldest files in my archives are from late high school, by which time I knew a lot more maths, and I was only using QBasic occasionally, as a tool. In year 12, for my IB Extended Essay, I wrote some code to plot the bifurcation diagram of the logistic map for parameter values between 0.001 and 4:
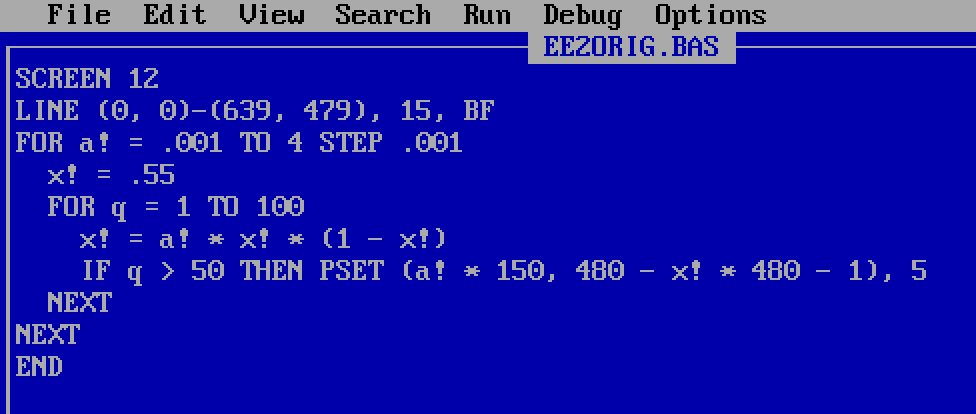
This code is not very interesting to me, and my comments are in a boring footnote.2 From very early on, I had a good handle on linear transformations from axes to pixel coordinates; I would not remotely have thought to do this calculation when I was 12, but given the instructions, I could have done the iterations and generated the plot.
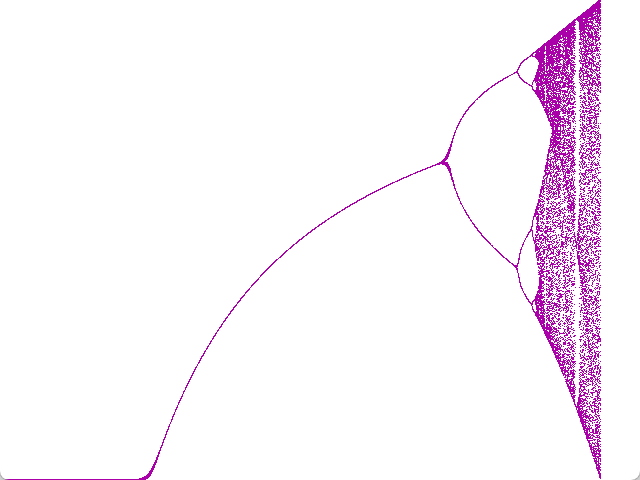
(The grey pixels in the bottom-left and -right are the Windows 11 rounded corners of the DOSBox window.)
Later in year 12 I evidently had an assignment in the group theory Further Maths module. I was given a binary operation’s multiplication table on a set of 8 elements, and had to test if the operation was associative. My code took the 8 × 8 table and turned it into a function f with eight CASEs in a SELECT CASE block for the first operand, all of those but the identity element having eight CASEs in a SELECT CASE block for the second operand. The function runs to over 130 lines, and must have been quite tedious to type.
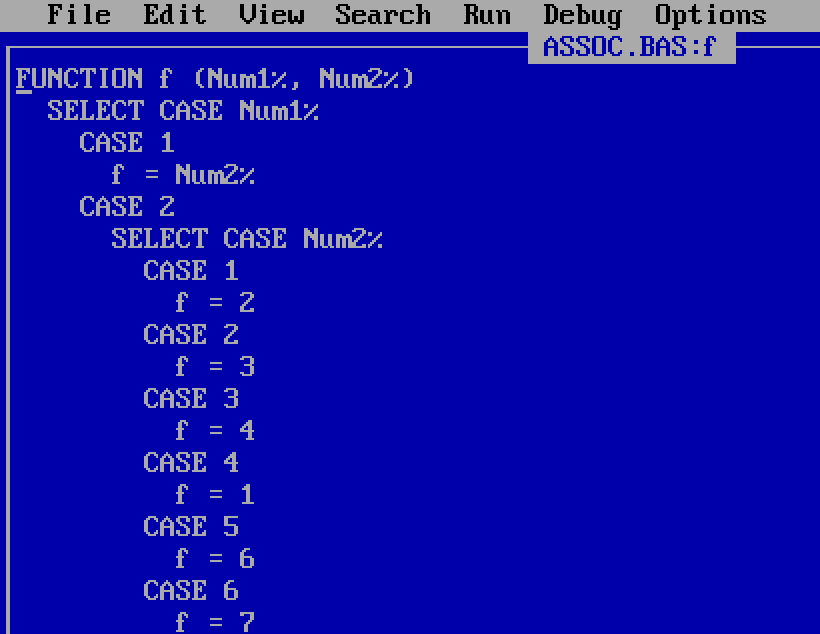
Much tidier would have been defining f as a two-dimensional array instead of a function, the multiplication table entered in lines of comma-separated DATA values.
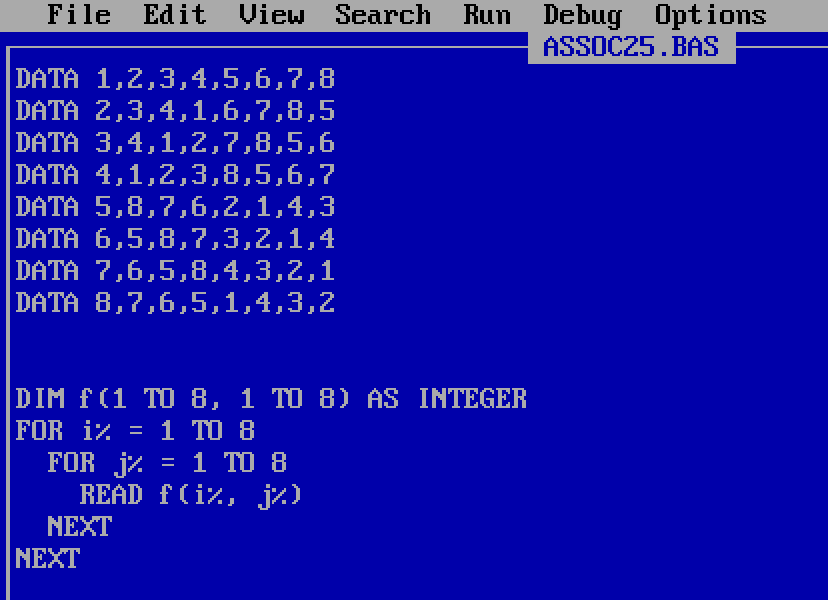
The loop over all 512 combinations of three elements to test for non-associativity – IF f(i%, f(j%, k%)) <> f(f(i%, j%), k%) – can stay the same, since QBasic uses parentheses both for array indexing and for function arguments. But my old code still worked, which is the most important thing for a one-off assignment problem, and if I was studying group theory then it’s hardly reflective my very early programming.
For a few years I wanted to write games. My most sophisticated project, abandoned probably at age 14 or 15, was inspired by Commander Keen. There was top-down tile-scrolling around a map, and when you arrived at certain locations, it switched to a non-scrolling side-on screen (I never got pixel-by-pixel scrolling working fast enough). Starting on the left-hand side of the screen, you could run, jump, and shoot at enemies on your way to the right-hand side.
I submitted it as a work-in-progress to a website that wanted to host QBasic works in progress, but I was told that it ran too fast on the website owner’s computer. I couldn’t test it on a faster computer than the one I had, so it didn’t make it online, and eventually I moved on. It’d be fun, for me at least, to try playing it, but I don’t have the code anymore.
One thing I’m sure of is that, if I did have the code to study and modify, then I could improve the jumping. For the first frame of the jump, I would have the character’s y-coordinate decrease (move up the screen) by some amount, say 6 pixels. Then subsequently the change in the y-component would be one pixel less: 5 pixels on the second frame, 4 on the third, eventually reversing for the downward part of the trajectory. This makes a parabola, so the dynamics were reasonably decent, but it probably would have been better to store position and velocity components and apply basic suvat equations from kinematics.
A still live Angelfire website contains evidence of an early game I wrote, a Frogger clone. The site hotlinks to a zip file hosted on NeoZones when the latter was on GeoCities, meaning that the link has been dead for somewhere around a quarter of a century. NeoZones is not archived on the Wayback Machine.
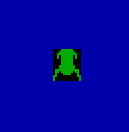
I still remember that game’s most glaring flaw. I’ll assume that I was working in SCREEN 13, for 320×200 resolution VGA graphics with a palette of 256 colours which could be customised. My memory is that I created the sprites using DATA statements, reading the numbers into integer arrays that could be PUT onto the screen. When trying to recreate this process, I was surprised at how technically difficult it was: since there are 256 possible colours for each pixel (requiring 8 bits), and an integer is a 16-bit data type, two pixels are packed into each element of the array, with the first pixel occupying the lower-order byte. The first two bytes of the array give the width in bits of the sprite and the height in pixels.
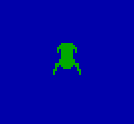
I have no memory whatsoever of these details, making me wonder if I did something differently, or instead if I just mindlessly followed a recipe that someone had shown in a tutorial somewhere. Anyway, at the end of it all, I would have had a green frog on a black background, something approximately as artistic as what I could make today:

Now the challenge that presented itself to budding QBasic game programmers was that if you PUT this image in PSET mode, then the background pixels of the sprite would overwrite the previous colours that had been on the screen there. So if the frogger was in blue water, you would have this undesirable effect of pixels that should have been water displaying as black:
QBasic doesn’t have any notion of an alpha channel for transparency/opacity. The sophisticated way to handle this problem, which I later learned, was to create a corresponding mask array, and take advantage of the different PUT modes. Each of these modes set pixels by doing a different bitwise operation on the colour values (previous and new), each colour value being an integer between 0 and 255, one of the 256 colours in the palette.
If a pixel in the sprite has colour 0 (black; assumed transparent background), then the corresponding pixel in the mask should have value 255, which is 11111111 in binary; if the sprite pixel is nonzero (foreground), then the corresponding mask pixel should have value 0. Then:
PUTthe mask with modeAND. This will set all the foreground sprite pixels to black (colour 0), because anything AND 0 is 0. All background spite pixels will be left unchanged, because any 8-bit integer AND binary-11111111 leaves the integer unchanged.PUTthe sprite with modeOR. Since the sprite’s background pixels have value 0, the background gets OR’d with 0 and stays unchanged. The foreground pixels, after the maskPUT, are 0, and the sprite’s foreground pixels are therefore OR’d with zero and are displayed unchanged. Both background and foreground are therefore displayed correctly.
This was again annoyingly difficult to implement when I did this today (as I write). To pack the two pixels into an integer, I was doing &H100 * i% + j%, and when i% and j% are both &HFF, the result is a signed-integer overflow error. Anyway, after some tedious fiddling around with negative numbers, I got my frog with the correct background:
But that is not what I did when I was thirteen (twelve?). Instead I took a shortcut that I’d seen recommended: just PUT the sprite with mode XOR. This leaves the background pixels correct, but it changes the foreground colours, because they get XOR’d with whatever the previous pixels were:

I’m sure I didn’t use exactly those colours, but it was something of that nature, the frog changing colour when it was in the water or on a log or a crocodile.
I’m a little disappointed in teenage-me over this. Even if the mask/sprite operations were too intimidating, I now see a solution that did not require a mask array. What I could have done was kept my XOR PUTs as they were, but then calculated the palette value of each of the different XOR operations (there would not have been many: only a small number of colours would ever have been a background for the frog). Once I had these, I could have modified the palette colours so that the various XOR’d foreground pixels were all the same shade of green.
But my disappointment comes from my greater understanding today of bitwise operations. At the time, I had no idea what the AND, OR, and XOR modes actually did when you PUT something to the screen. They were just different opaque options that gave different visual effects. I did not know enough to use them well, and it did not occur to me to try to learn.
The rating of 6/10 that the still-live website gave my “okay” game was generous, a reflection of the fact that much of the QBasic community was young like me and submitting programs that were not very good.
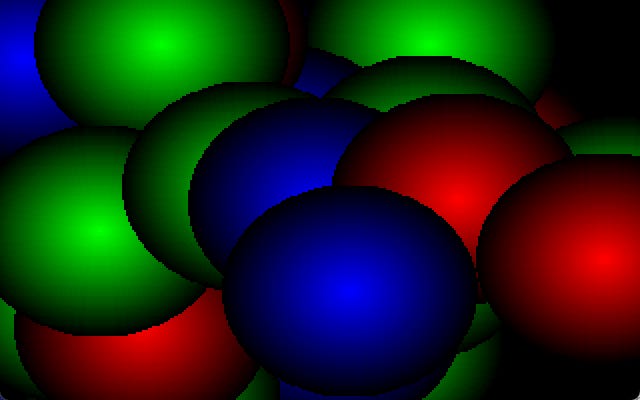
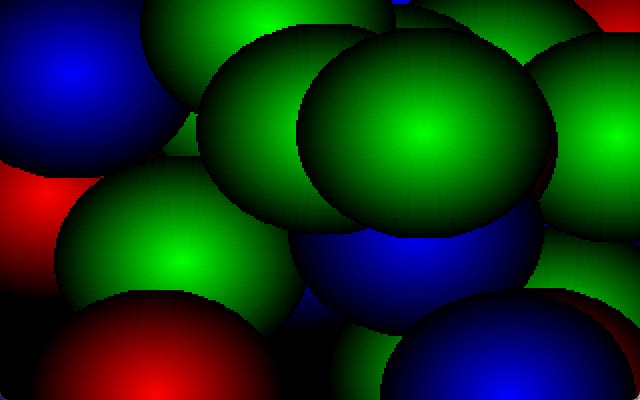
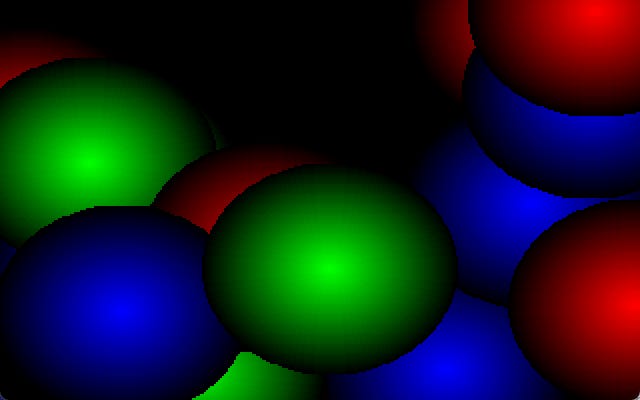
That same site on its graphics page has a dead hotlink to my colour spheres demo, again getting a 6/10 rating, but this time with the rather more positive comment, “neato”. And this file still exists!!!! A different recovered GeoCities site has a download on this page.
The unzipped BAS file has a modification date of 31 May 1998, but the file includes a “Downloaded from the QBasic Place” comment inserted by the website owner, indicating that the code was actually written earlier, I would guess in 1997. Let’s take a look.
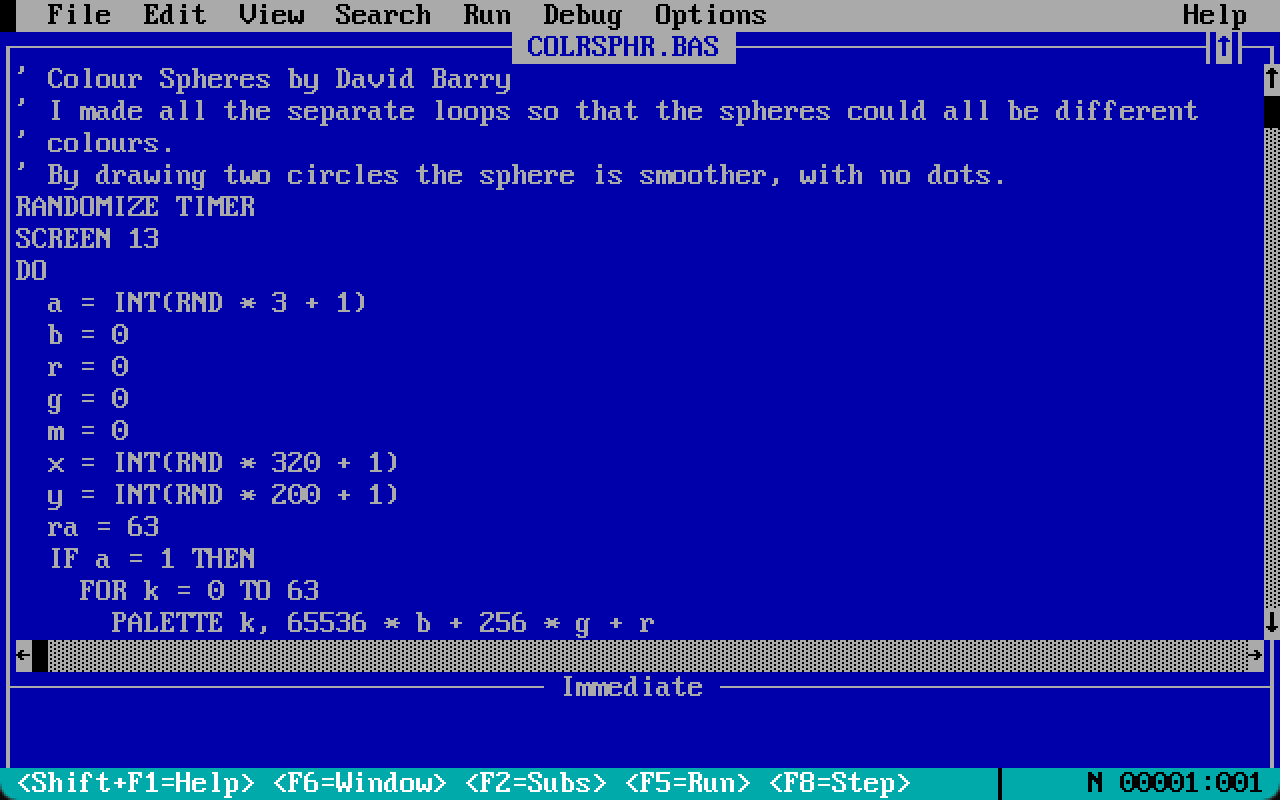

We have a DO loop terminated by a standard keypress. No type suffixes are used, so all variables are floats. Variable a is set randomly to 1, 2, or 3, and this sets the colour of the sphere to either red, green or blue. The three colour components are initialised to zero; the outer edge of the sphere will be drawn first, and this part is in shadow.
Variable m is unused and should have been deleted. The centre of the sphere is at (x, y), with x random over [1, 320] and y random over [1, 200]; these are off-by-one, since the top-left pixel is at (0, 0) and the bottom-right at (319, 199), though one pixel is hardly important when half the sphere might be off-screen.
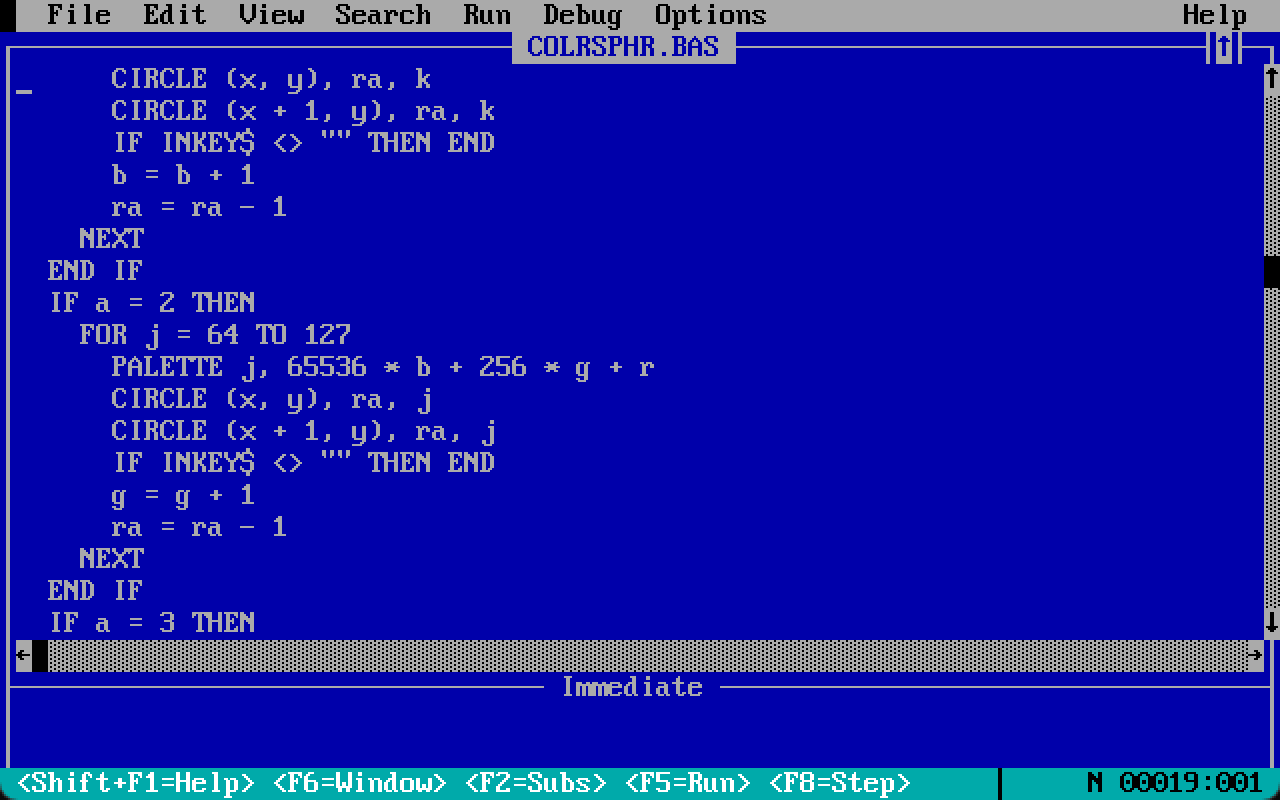
Variable ra is initialised to 63; this is the radius of the first pair of circles drawn. This radius was deliberately chosen to match the resolution of the available colours: each of the red, green, and blue channels could take a value between 0 and 63. The circles would therefore be drawn with decreasing radius and increasing values in one of the three colour channels.
The circle-drawing code is largely duplicated across the three sphere colours. A FOR loop runs over the palette indices for the selected sphere colour. The palette index is set to the appropriate shade of red, green, or blue. A circle is drawn of the current radius centred (x, y), and a second circle at (x + 1, y). The colour channel value is incremented and the radius decremented.
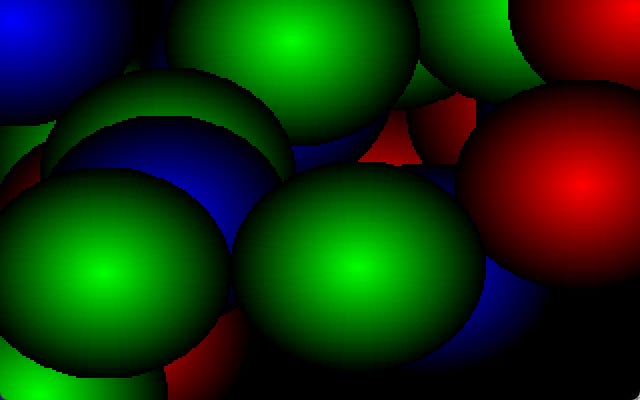
The two circles are drawn because otherwise you see the dots referred to in the introductory comment:
(I assume that I did not find this trick on my own, but was instead blatantly copying someone else, my innovation being only the loop with random colours and locations.
An alternative to the two circles would be to draw one circle and then flood-fill it with PAINT, and I think I would have been aware of this idea but rejected it because the animation looked worse.)
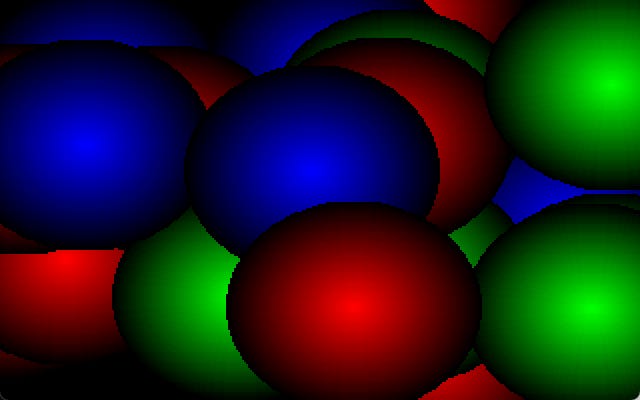
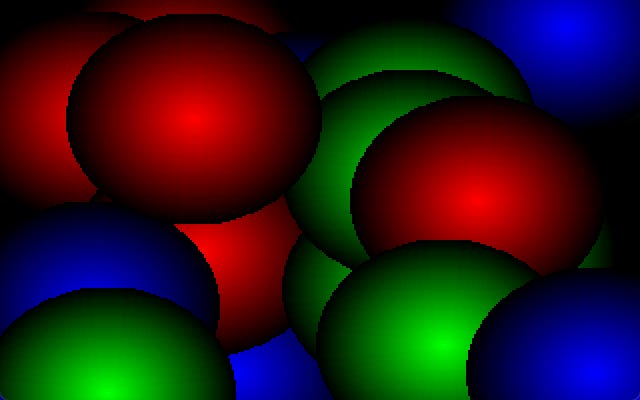
I’ve been using different outputs of the program for this post’s section dividers:
I’d do a few things differently today:
Firstly, the palette should be set prior to the main loop. There is no need to repeatedly reset the colours.
The circle drawing duplication can be removed, with an array used to store offsets for the appropriate palette indices for each sphere colour.
I’d sacrifice some smoothness of the colour gradients to allow for more than three basic sphere colours, picking the central colours from a colour wheel.
There are too many dark shades. The spheres don’t have to go all the way to black.
The spheres can be different sizes, with small spheres more common than large ones.
If I wanted to get fancier with more palette changes during the animation, then I’d replace the
PALETTEstatements withOUTcalls directly to the relevant VGA ports, which is much faster. This was a well-known technique in the QB community that I evidently hadn’t learned yet. But since I’m now only setting the palette once at the start, this optimisation is not necessary.
By the standards of a late-1990’s QBasic website, that has to be a 7/10 demo.
QBasic doesn’t allow a command to split over two lines, so some of these lines go longer than the 32 characters I try to limit myself to for Substack mobile reading:
TYPE RGBColor
  r AS INTEGER
  g AS INTEGER
  b AS INTEGER
END TYPE

DECLARE FUNCTION redFromWheel (t%)
DECLARE SUB colorFromWheel (outCol AS RGBColor, t%)
DECLARE SUB setColors (i0%, n%, s!, col AS RGBColor)

RANDOMIZE TIMER
SCREEN 13

'Number of base sphere colors
CONST nCols% = 16
CONST nCols1% = nCols% - 1

'Color wheel constants;
'w1% is the length of one part
'of the wheel; w% the full wheel
CONST w1% = 63
CONST w2% = 2 * w1%
CONST w3% = 3 * w1%
CONST w% = 6 * w1%

'Palette index for start of
'each sphere color:
DIM offsets(nCols1%) AS INTEGER

'Number of palette indices to
'use for one base sphere color.
'Color 0 stays unchanged so
'that the background stays
'black; 255 colors to work with
cs% = 255 \ nCols%
IF cs% > 64 THEN cs% = 64

DIM baseC AS RGBColor

FOR i% = 0 TO nCols1%
  'Palette color index:
  ip% = 1 + i% * cs%
  offsets(i%) = ip%
  'Index in color wheel:
  iw% = w% * i% / nCols%
  colorFromWheel baseC, iw%
  setColors ip%, cs%, .5, baseC
NEXT

FOR sph% = 1 TO 250
  'Sphere color:
  sc% = INT(RND * nCols%)
  x% = INT(RND * 320)
  y% = INT(RND * 200)

  'Make smaller spheres more
  'likely:
  rad01! = RND
  rad01! = 1 - rad01! ^ .2
  rad% = INT(10 + rad01! * 54)

  FOR r% = 0 TO rad%
    c% = (cs% - 1) * r% / rad%
    c% = c% + offsets(sc%)
    CIRCLE (x%, y%), r%, c%
    CIRCLE (x% + 1, y%), r%, c%
    IF INKEY$ <> "" THEN END
  NEXT
NEXT

SLEEP (5)
END


FUNCTION redFromWheel (t%)
  't% position in color wheel,
  'in range [0, 377]
  r% = ABS(t% - w3%) - w1%
  IF r% < 0 THEN r% = 0
  IF r% > w1% THEN r% = w1%
  redFromWheel = r%
END FUNCTION

SUB colorFromWheel (outCol AS RGBColor, t%)
  outCol.r = redFromWheel(t%)
  t% = (t% + w2%) MOD w%
  outCol.g = redFromWheel(t%)
  t% = (t% + w2%) MOD w%
  outCol.b = redFromWheel(t%)
END SUB

SUB setColors (i0%, n%, s!, col AS RGBColor)
  'i0% first palette index
  'n%  number of palette indices
  's!  value between 0 and 1;
  '    1.0 generates colors all
  '    the way to black.
  'col the base color
  iend% = i0% + n%
  i% = 0
  FOR idx% = i0% TO iend%
    f! = (n% - i% * s!) / n%
    r% = col.r * f!
    g% = col.g * f!
    b% = col.b * f!
    c& = r%
    c& = c& + &H100 * g%
    c& = c& + &H10000 * b%
    PALETTE idx%, c&
    i% = i% + 1
  NEXT
END SUBFor more realism, you should imagine 8-space tabs, the default of the QBasic IDE. I discovered only in recent days that you can change the tab stop size in the options. I’ve used two spaces throughout this post for tidier presentation.
It’s stylistically a touch annoying that my looping variable q isn’t given a type suffix, meaning that it is stored as a float rather than an integer.
The code is very slow, at least in the DOSBox emulation, and it seems excessive to use 4000 values for the parameter plotted on the horizontal axis when the axis is only 600 pixels wide. But plotting only 600 parameter values leads to the points being visibly separated vertically, so I understand and agree with my teenage self’s decision to use the very fine discretisation.
I would do two things differently today. Firstly, I would test for convergence, terminating the inner loop if the values aren’t changing much. This should save some time that is currently spent iterating a value at a fixed point or low-period cycle. With the freed up time, I would increase the number of burn-in iterations before the start of plotting. You can see the curve getting thicker near the bifurcation points, which is caused by the convergence being very slow there: more iterations would sharpen up the curve.
But overall this code was fine for what it was. It didn’t need to be fast, it just needed to successfully run once so that I could screenshot the graph and put it into the essay.